Dashboard below is based on the data from about 90000 Shopify stores[1] all over the world.
Tree Map Shows the stores distribution in different countries. For instance you can see most stores are based in US (more than 60%). If you hover on the squares in the map, the information (Country name and share of stores) appears.
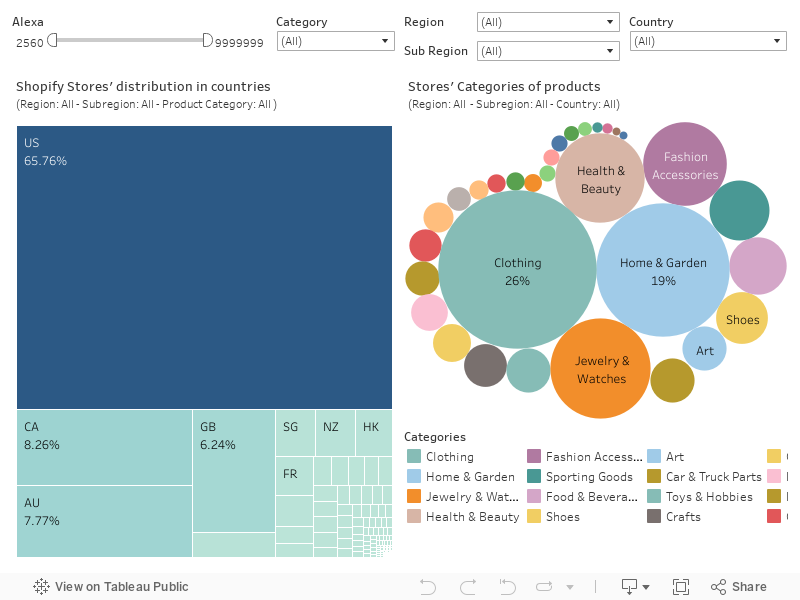
You can filter the map based on “Alexa rank”, “Region and Country”, different “Categories” and see the stores’ distribution after your desired filters.
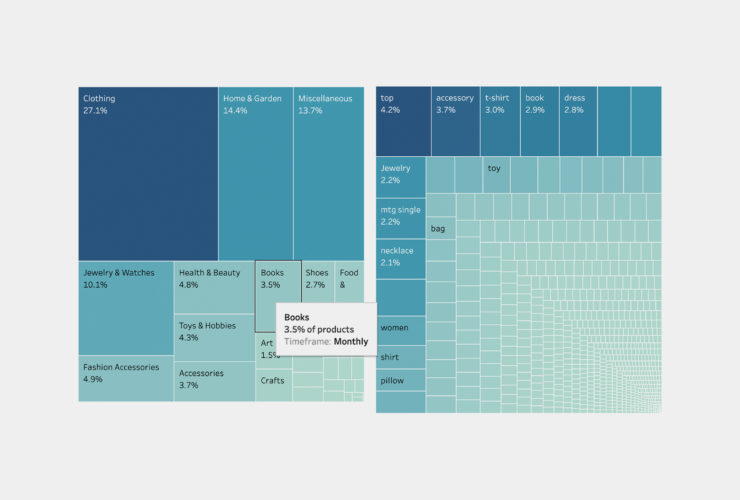
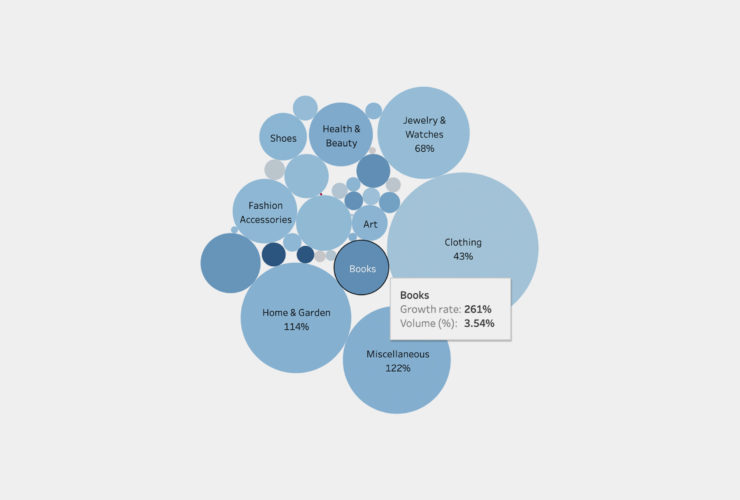
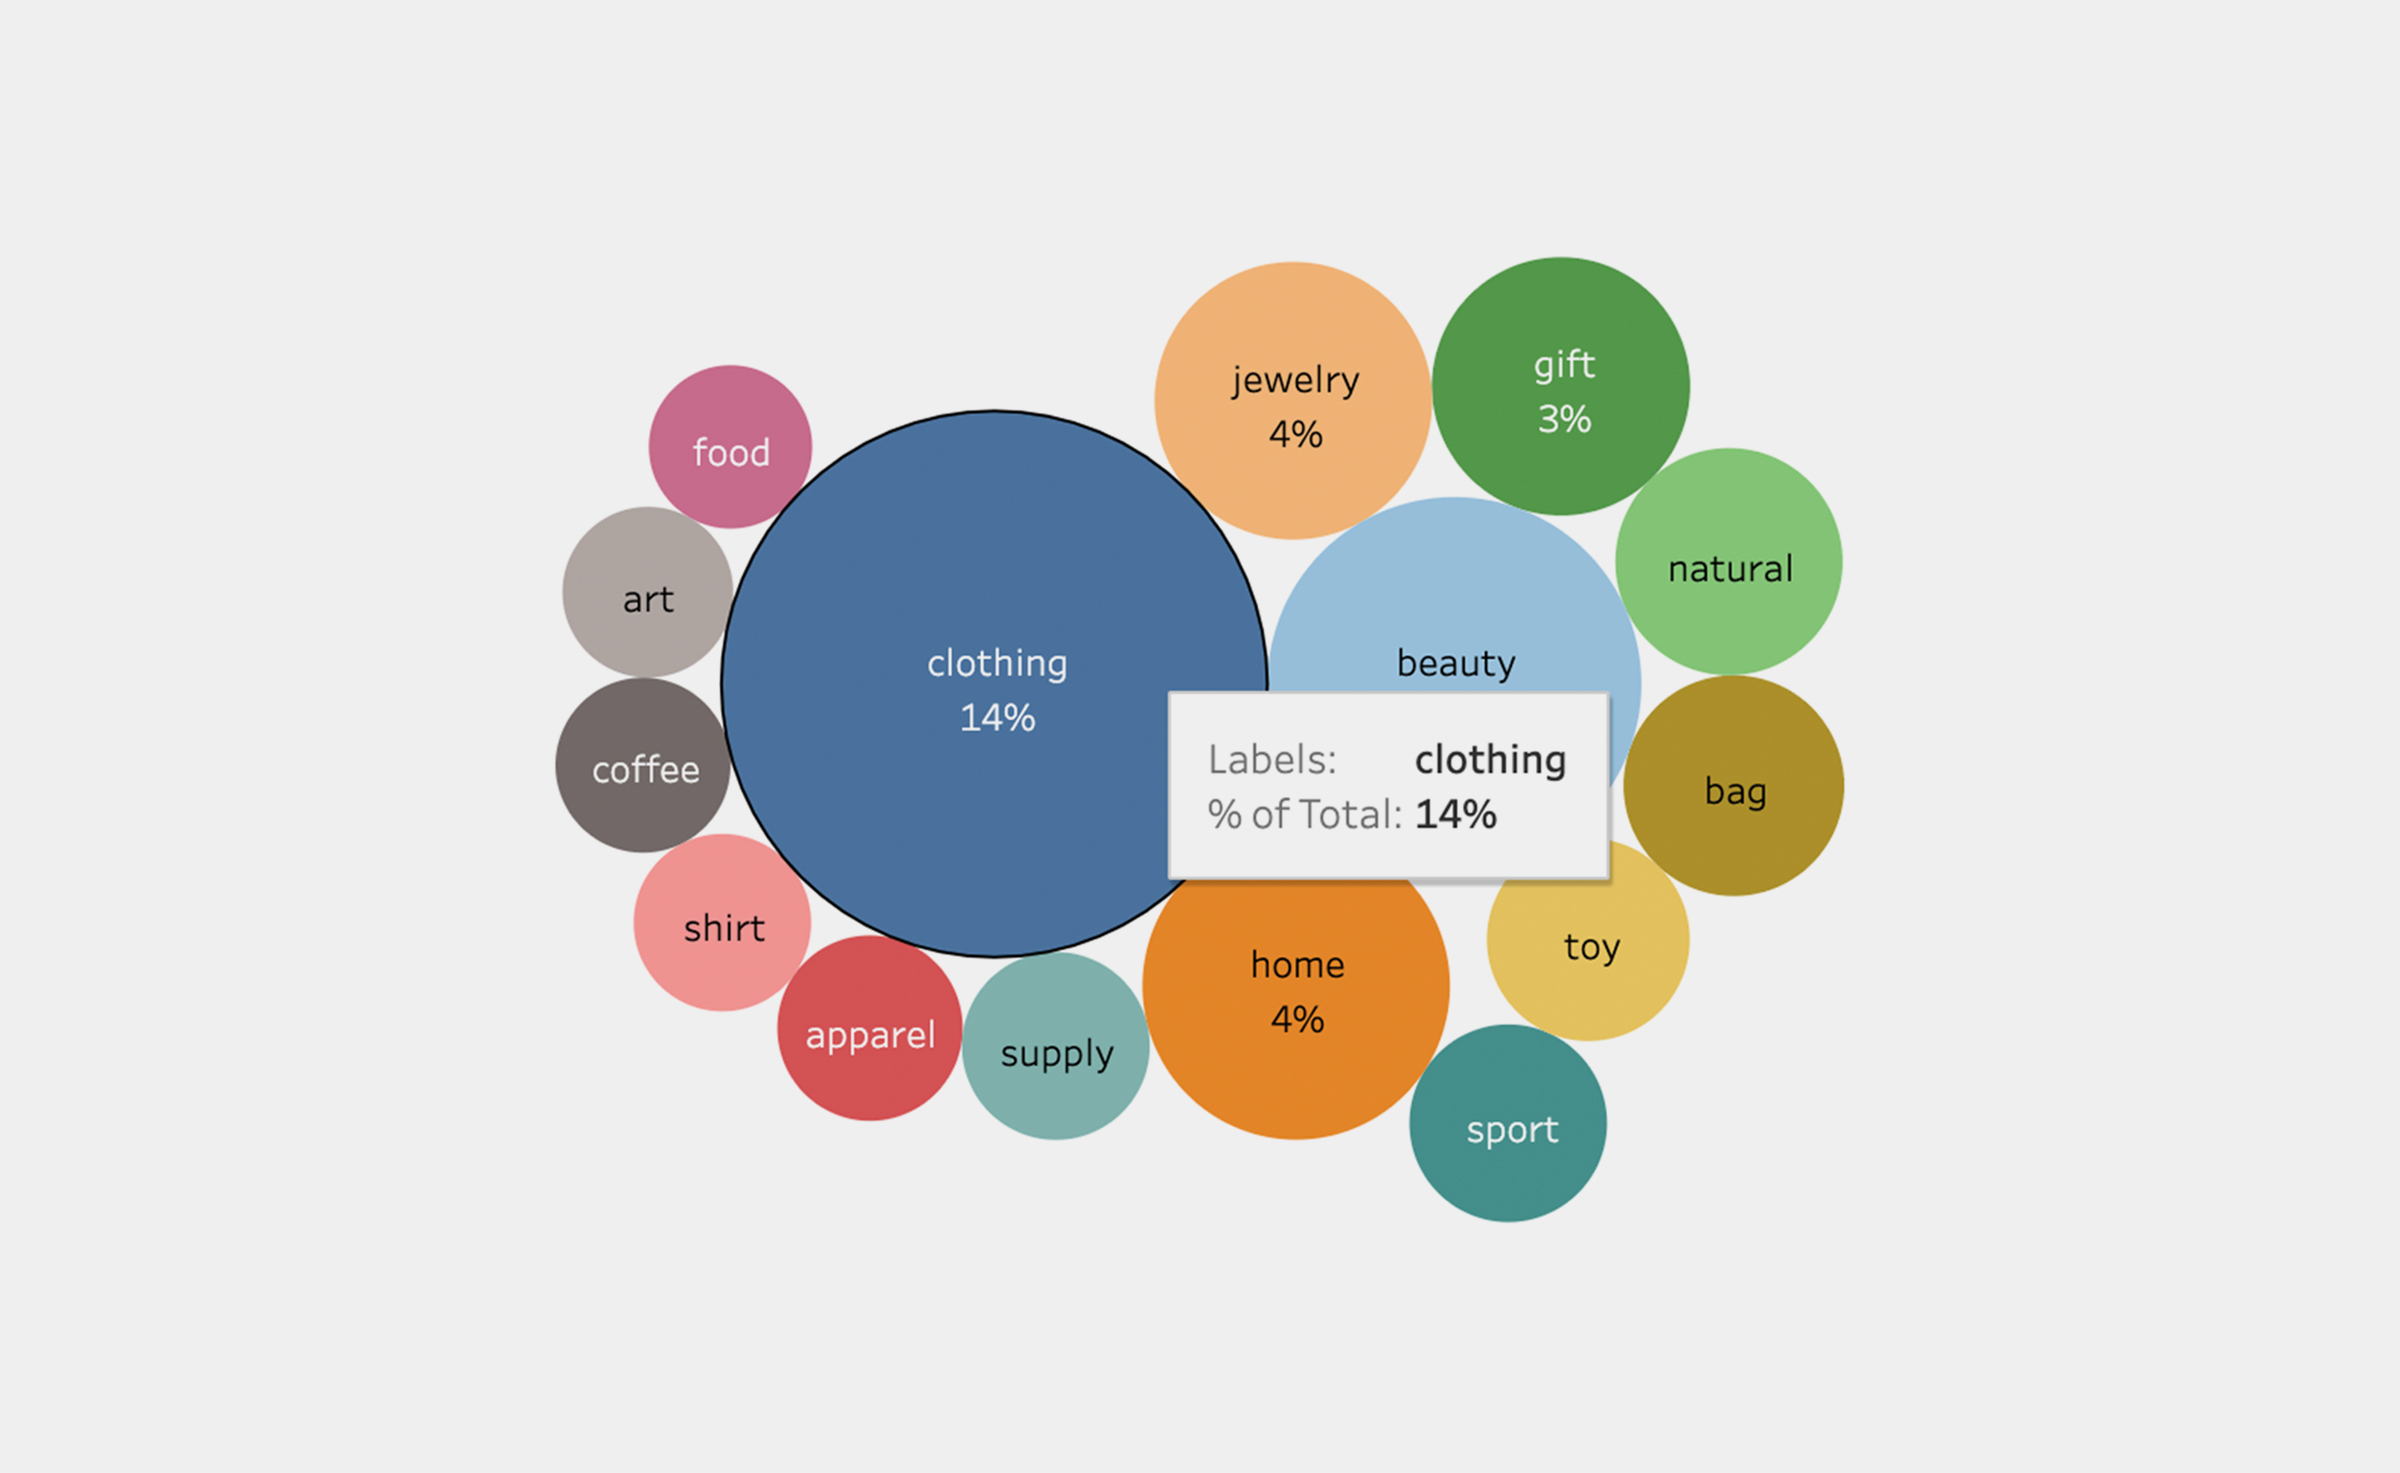
Also, there is a “Bubble map” below the tree map which shows the stores main categories of products[2]. According to the bubble map, “Clothing”, “Beauty” and “Home” categories have a big share in Shopify stores. Using the aforementioned filters, you can see the changes in the stores’ categories.
Do not forget to erase your previous filters when you want to apply new filters.
[1] We used the data from stores which had the Alexa rank below 10 million
[2] We filtered top 31 main categories of products to make the dashboard easy to use