There is a dashboard available for surfing in Shopify stores’ trending products. The dashboard is consisting data of more than 20 million Shopify products.
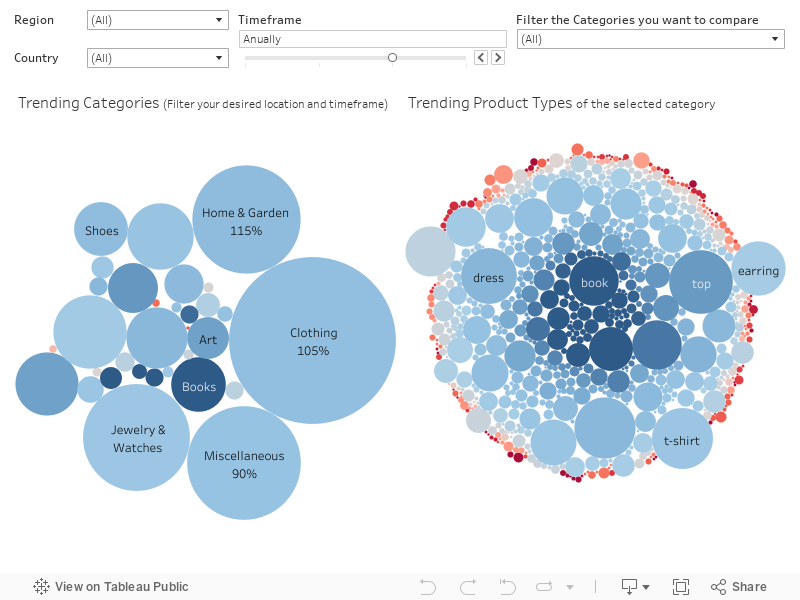
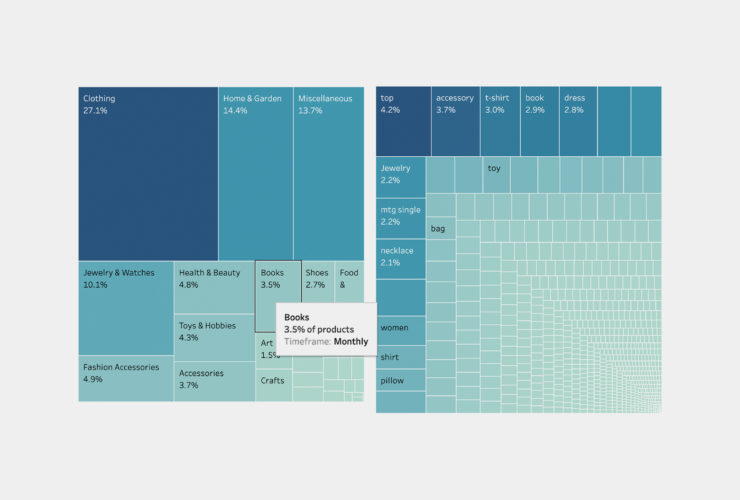
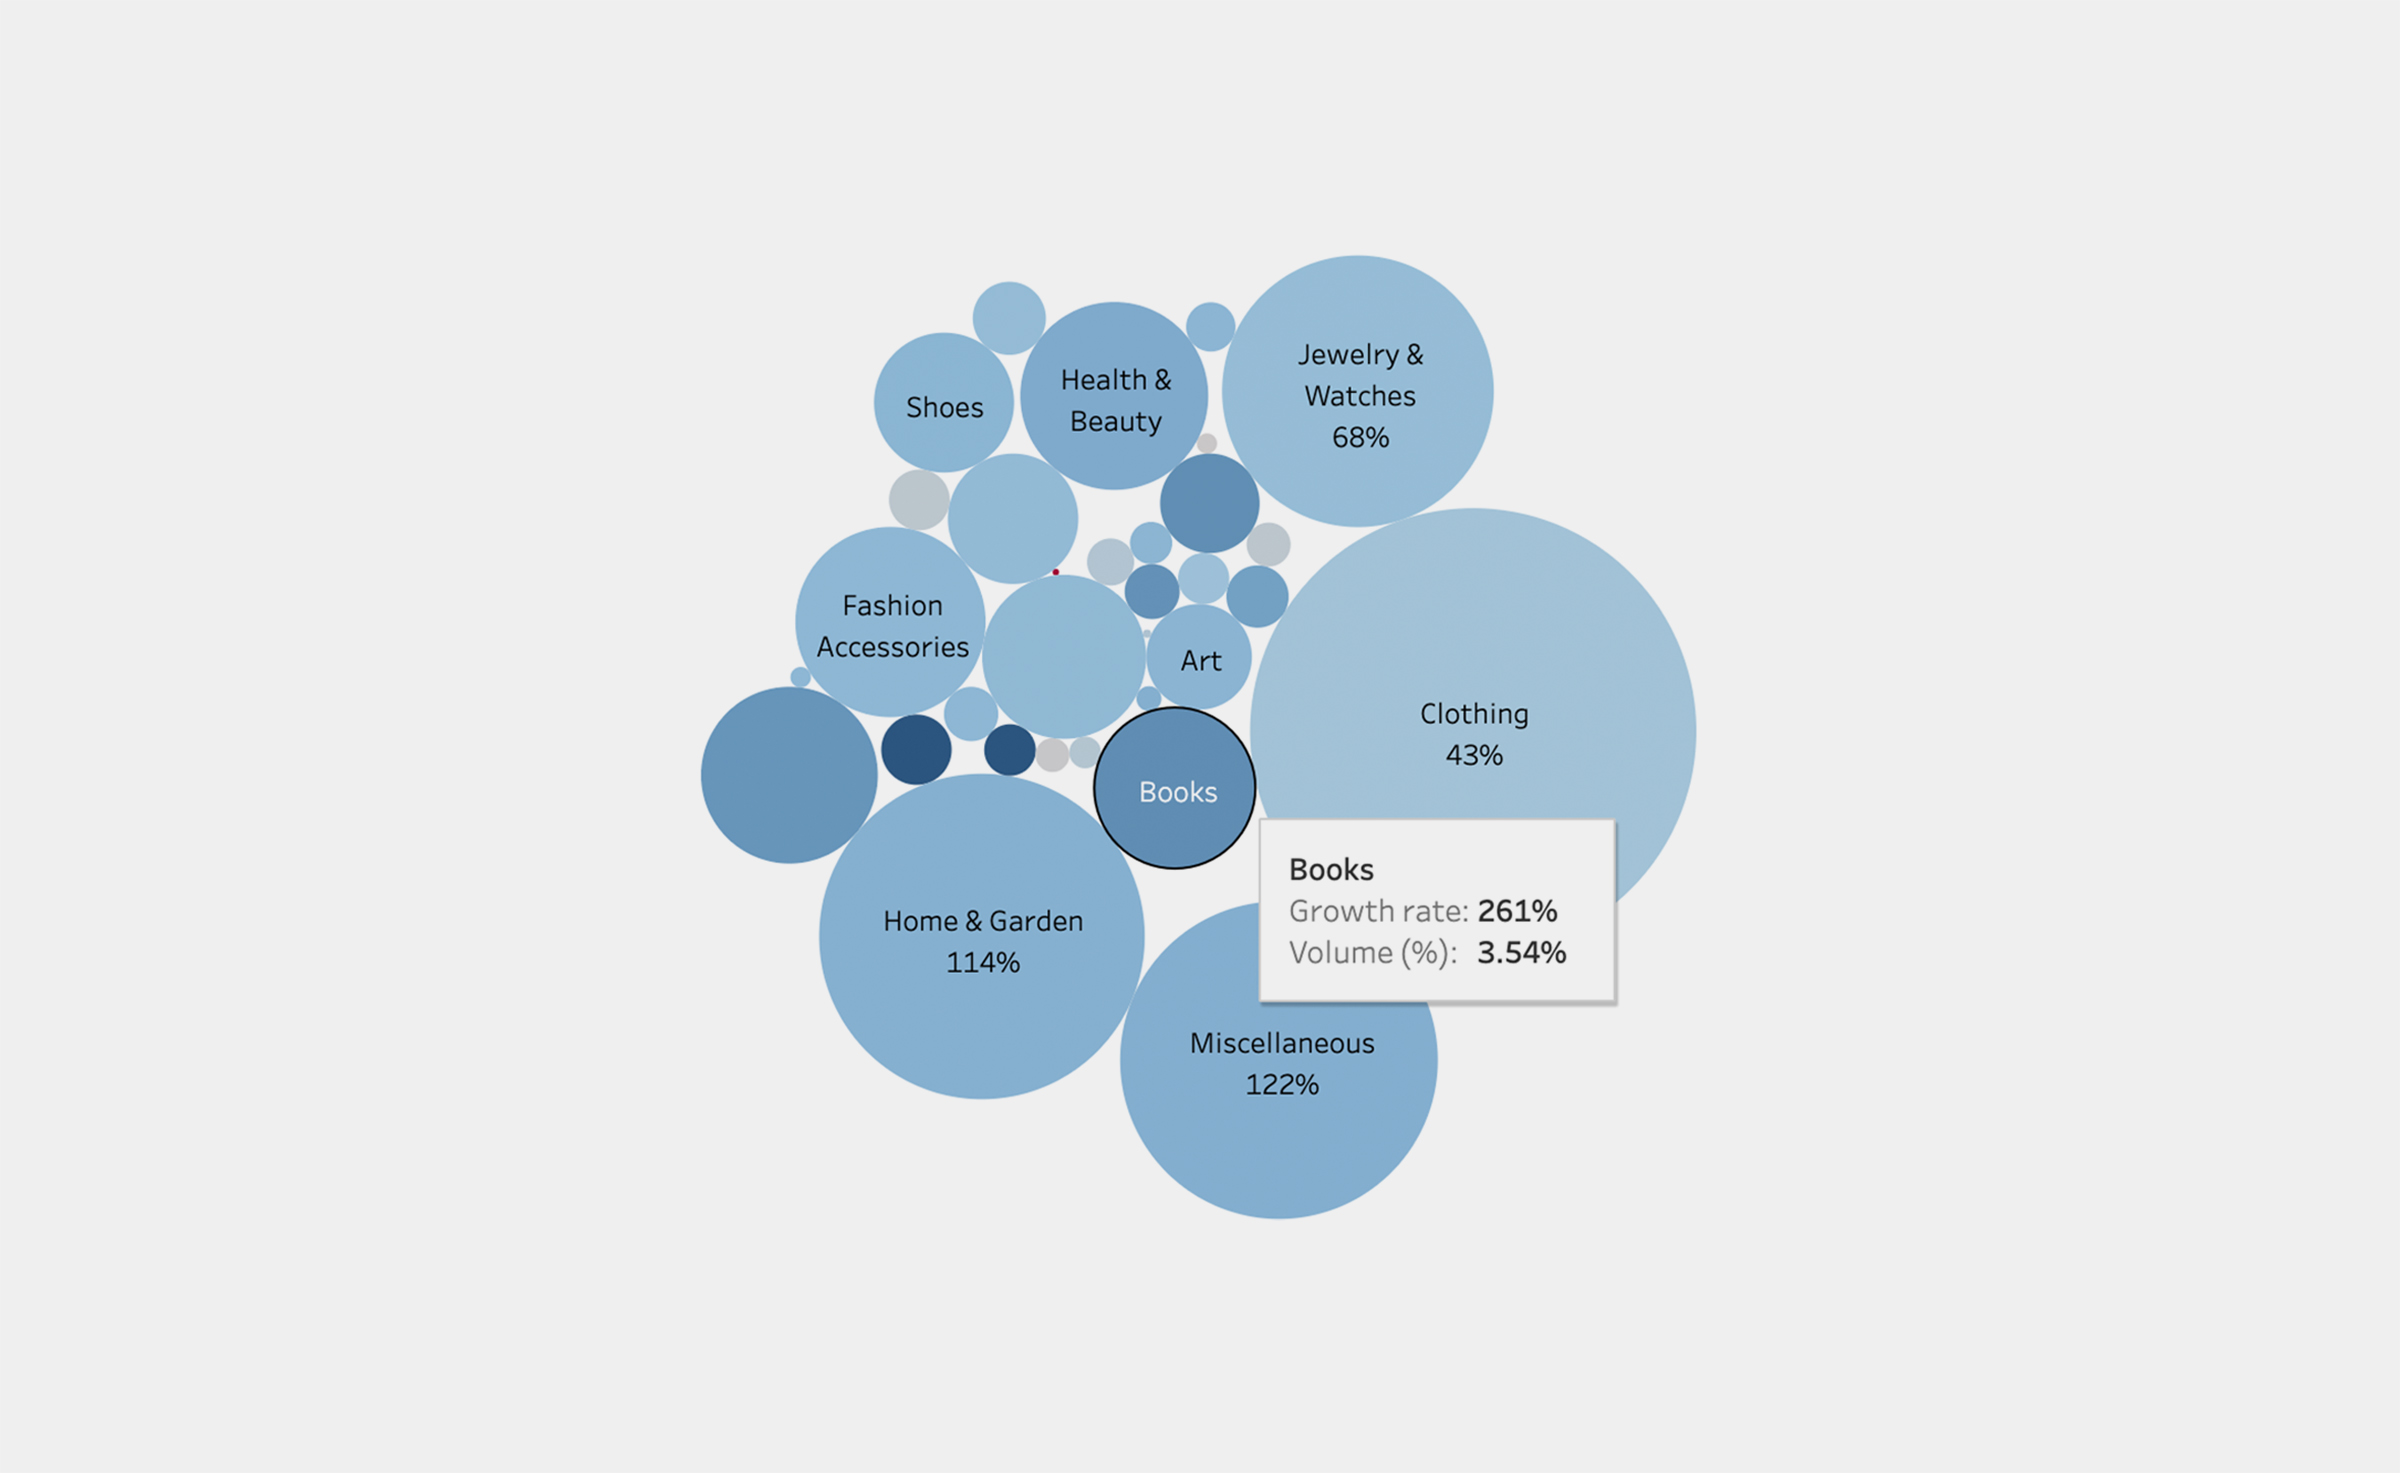
There are two “bubble maps” in the dashboard, first map is for products “main categories[1]” and the second one is for “product types” which is more detailed. The size of the bubble shows the category/type popularity and its share in Shopify sales. The color of the bubbles shows their growth rate in a specific timeframe. The more trending the category/type, growth rate is higher and the color of the bubble is bluer!
If you hover on the bubbles in the map, the related information appears.
The product sales growth rate changes in time. We have calculated the growth (and popularity) in different timeframes: last month, last 3 months, last 12 months and in special events like Black Friday or Christmas. You can choose your desired timeframe in the dashboard.
Also, you can apply the filters above the dashboard to make conditions on the data and see the result on both category and product type maps. You can filter the results by your desired location(s) by filtering region and country. If you want to compare specific categories or find a category to see its product types sales growth (and popularity), use the “Category” filter above the dashboard. These filters apply on both category and product type maps.
Do not forget to erase your previous filters when you want to apply new filters.
[1] We filtered top 30 categories to make the dashboard easy to use